Signature Projects are intended to bring focus to a selection of U.S. Department of Energy's Water Power Technologies Office (WPTO) projects. By designating a Signature Project, the project reports, datasets, and associated papers can be easily discoverable. By bringing together all aspects of a project, whether a completed legacy project or an ongoing investigation, the MRE community can be informed of what investigations have been undertaken, which have succeeded, what tools are available, and where gaps in information persist.
Marine Energy Resource Assessment and Characterization
Project Purpose
To understand the full potential for future electricity production using energy harnessed from our nation’s water resources, the U.S. Department of Energy’s Water Power Technologies Office (WPTO) conducted the following resource assessments:
- Waves—energy made from the surface motion of ocean waves
- Tidal streams—energy created by the ebb and flow of water caused by tides
- Ocean currents—energy produced by the flow of water resulting from large-scale ocean circulation patterns
- River currents—energy found in the downhill flow of rivers, which can be harnessed without flow diversion structures, such as dams
- Ocean thermal gradients—energy caused by the temperature difference between ocean surfaces and deeper waters.
A summary of the resource assessments of these energy sources was published in early 2021 in “Marine Energy in the United States: An Overview of Opportunities.” The charts and tables below provide high-level overviews of the results presented in the summary.

This map shows the relative proportions of resources in the different regions of the United States and their total output in terawatt-hours (TWh) per year as compared to several island systems around the world. Image from John Frenzl, NREL.
There are three levels of resource assessments:
- Theoretical resource potential—the annual average amount of physical energy that is hypothetically available
- Technical resource potential—the portion of a theoretical resource that can be captured using a specific technology
- Practical resource potential—the portion of the technical resource that is available when other constraints (e.g., economic, environmental, and regulatory considerations) are factored in.
The following table is a reference for the theoretical and technical levels of U.S. marine energy resource potentials in terawatt-hours per year (TWh/yr).
| U.S. Marine Energy Resources | Theoretical Resource (TWh/yr) | Technical Resource (TWh/yr) | Technical Resource as Potential Number of Homes Powered | Technical Resource as Percent of U.S. Electricity Generation (4126.7 TWh) (%) |
| Wave (exclusive economic zone) |
3,300 | 1,400 | 130 million | 34 |
| Wave (to 10 nautical miles) |
1,800 | 770 | 72 million | 19 |
| Tidal | 440 | 220 | 21 million | 5.4 |
| Ocean Current | 160 | 49 | 4.6 million | 1.2 |
| Ocean Thermal | Not Reported | 540 | 51 million | 13 |
| River | 1,300 | 99 | 9.3 million | 2.4 |
| Total | 5,200 | 2,300 | 220 million | 57 |
WPTO is committed to identifying resource potential and continuing to refine these characterizations and adaptations of resource assessments to benefit large-scale commercial or blue economy applications as renewable marine energy technologies are further developed.
Project Description
Since 2016, the Resource Characterization project has been motivated by the recognition that detailed resource data is critical to the success of the marine energy industry. The Resource Characterization project also builds on earlier WPTO-funded resource characterization efforts published between 2011 and 2015. The project is a collaborative effort between the National Renewable Energy Laboratory (NREL), the Pacific Northwest National Laboratory (PNNL), and the Sandia National Laboratories (Sandia). For more information on the work being done by individuals labs, check out NREL’s Resource Characterization web page, PNNL’s Marine Resource Characterization web page, and Sandia’s Resource Characterization web page.
Project Methods
The goal of the project is to refine, extend, and disseminate the data necessary for marine energy device engineering and project planning. The project is organized around five primary activity areas: wave modelling and analysis, tidal current modelling and analysis, resource characterization and classification, resource measurement, and data dissemination. PNNL leads the modelling efforts, Sandia leads characterization and classification work, and NREL serves as the lead for resource measurements, data dissemination, and the overall project coordination. All of these activities are conducted with careful attention to best practices and methods recommended by the International Electrotechnical Commission's (IEC) Technical Committee 114. The project also has several public and private partners and holds quarterly calls with a steering committee of international experts and U.S. industry representatives to solicit guidance on key project decisions.
Key Findings/Applications
The data and tools generated by this project are used by technology developers for device design and by project developers for optimal siting, array design, and economic assessment. The data is also critical to convey the value of marine energy to the public, offer energy assessments (power supply and energy portfolio diversification) to regional planners and policy makers, share operational reliability and economic assessments with utilities workers and investors, and provide environmental impacts studies to regulatory agencies.
Wave Modelling and Analysis
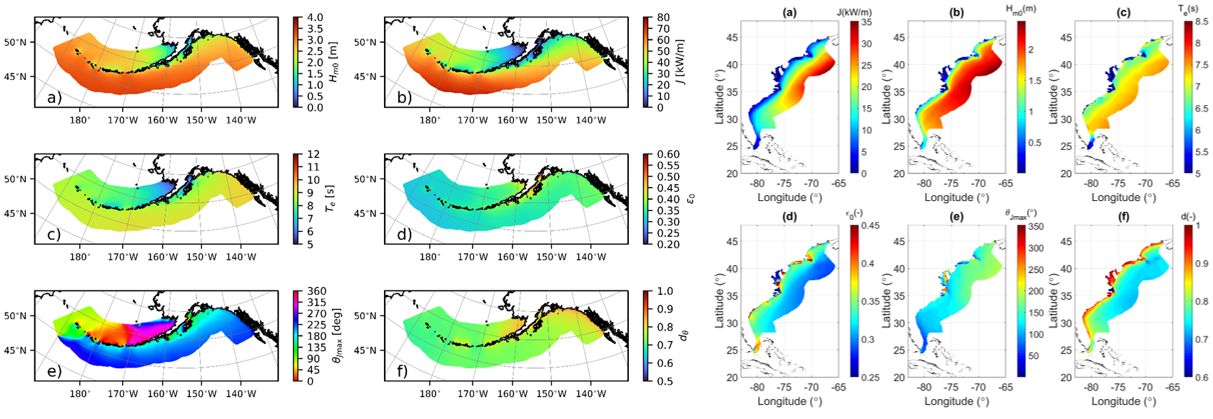
As part of the project, team members are developing high-resolution wave models for all of the U.S. coastal regions extending to the exclusive economic zone (Allahdadi et al 2019, Wu et al. 2020, Yang et al. 2020, Garcia-Medina et al. 2021, Li et al. 2021). All hindcast data are in the process of being made publicly available on the Open Energy Data Initiative’s cloud server. Data include six IEC parameters (significant wave height, mean wave energy period, omnidirectional wave power, spectral width, maximum energy direction, and directionality coefficient) and several other variables (mean peak wave period, mean zero-crossing period, and mean absolute period). They also span 32 years (1979–2010) in 3-hour temporal resolution with horizontal spatial resolution as fine as 200 meters (m) in shallow water.

Tidal Current Modelling and Analysis
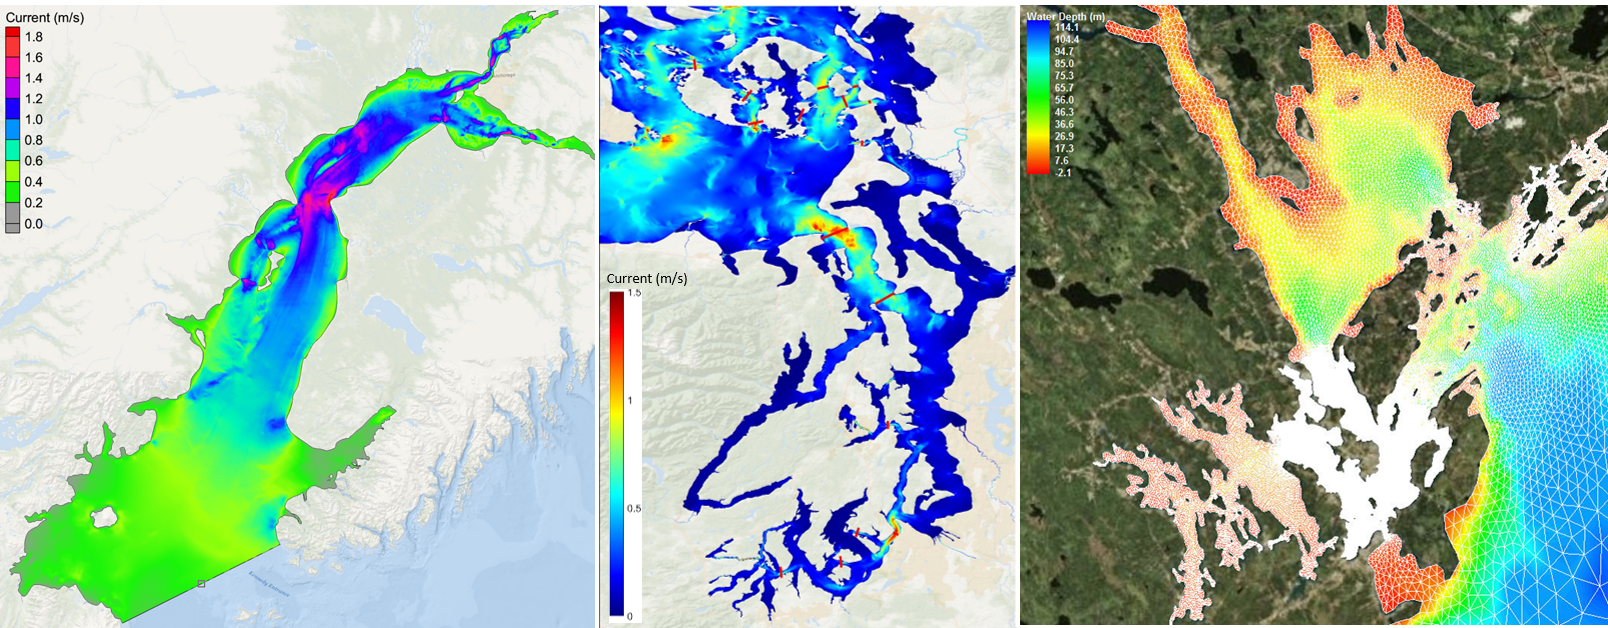
The project team members have created high-resolution tidal current models for three of the nation’s largest tidal energy resource sites—Cook Inlet, Alaska; Puget Sound, Washington; and Western Passage, Maine (Wang and Yang 2020, Yang et al. 2020, Yang et al. 2021). Data generated from the tidal models include tidal water levels, three-dimensional tidal currents, and tidal harmonic constituents for both tides and currents. In addition, the team performs modeling analysis to refine and improve methodologies for tidal current resource estimates in tidal channels and coastal bays.

Resource Characterization and Classification
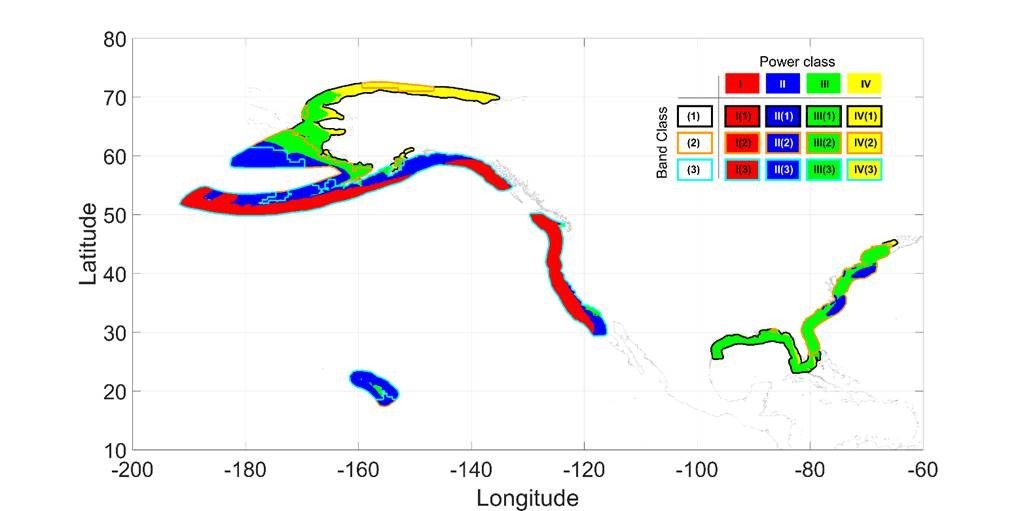
The project team developed high-fidelity methods for wave energy resource characterization (Ahn et al. 2020), examined nonstationary trends in U.S. wave energy resources (Ahn and Neary 2020), and developed methods for characterizing extreme wave conditions used for wave energy converter design (e.g., the 50-year return period wave height) (Neary et al. 2020). They also developed four classification systems, including resource classification systems (wave and tidal) and device classification systems (wave energy converters and tidal energy converters), as detailed in Neary et al. 2019. The team presented classification systems to the IEC standards committees for comment, both at the Technical Committee 114 International Plenary in the Netherlands in April 2019 and at national committees (e.g., United States, United Kingdom) in 2019–2020.

Resource Measurement
The team also deployed wave measurement buoys to provide model validation data. All wave measurement data are publicly available from the Coastal Data Information Program. Wave measurement buoy locations include Lakeside, Oregon; Reedsport, Oregon (decommissioned); Fort Bragg, California (decommissioned); and Kodiak, Alaska, Cape Hatteras, North Carolina (operational), Arecibo, Puerto Rico (active). Tidal current resource measurements have been collected in Admiralty Inlet, Washington, Western Passage, Maine, and Cook Inlet, Alaska.
